Logistic Regression for Class Prediction Using Python
One of the most common supervised machine learning techniques is Logistic Regression. It is primarily used to predict binary events occurring such as yes or no, true or false, and so on. Though, in this article, we will have more than two classifications. The inputs that we will be feeding to the model will be a combination of numeric and textual data. The output will be numeric values representing the probability of each class.
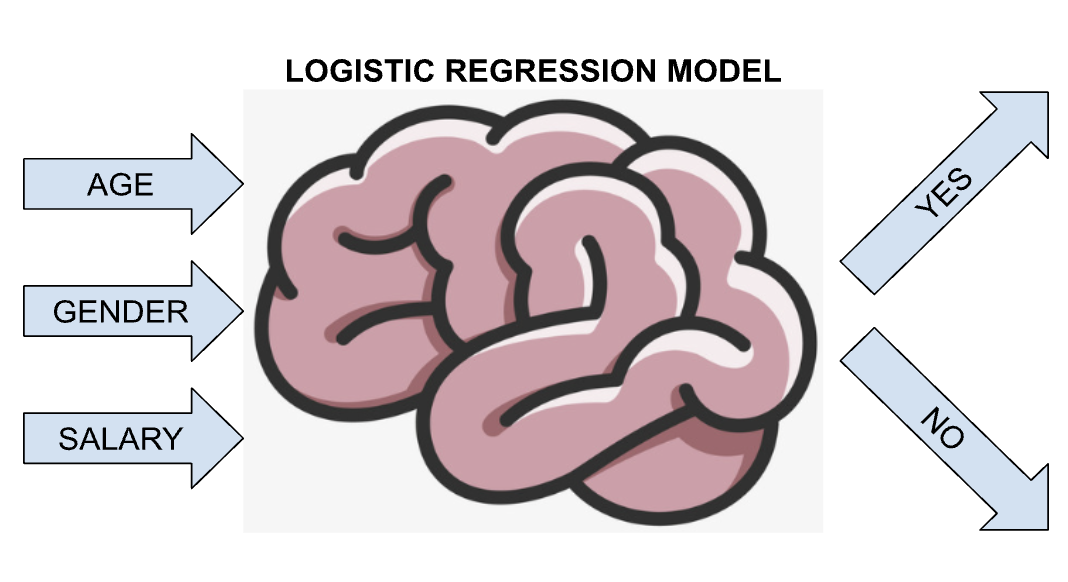
For context, supervised machine learning is a machine learning type where the data fed to the model has both inputs and outputs. The example data we will be using contains both the inputs and outputs. Logistic Regression is used when the target variable (dependent variable) is categorical or class-based. Examples of these are detecting if an email is spam or not, problems whose results or outputs are in the pattern Class A, Class B, Class C, etc.
In this article, we will be using Python to implement and create a simple Logistic Regression Model based on data with few columns. In the real world, data usually has many columns.
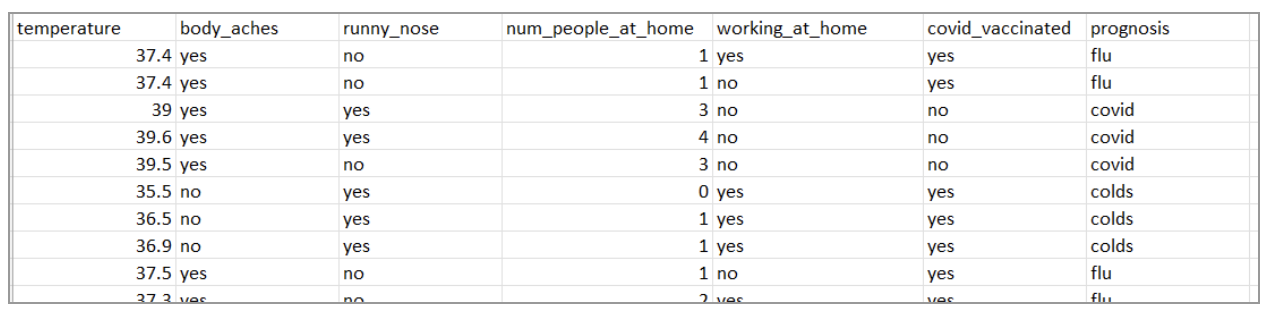
In the data above, there are 7 columns. The first six columns will be used as input while the last column (prognosis) will serve as the output during training. This data is just a mock data and did not come from a health care facility. This test CSV has 75 rows which is enough for this demonstration but probably not in a real-world setting or for research.
To process this data and feed it to a Logistic Regression model, we first import the necessary libraries.
import pandas as pd
import matplotlib.pyplot as plt
from sklearn.linear_model import LogisticRegression
The LogisticRegression library from sklearn is the library that will be used to make the classification model. The pyplot will just be used to visualize some data for demonstration purposes. Pandas is used to load the CSV data.
dataset = pd.read_csv('flu_covid_colds_activity.csv')We store our entire data from the CSV to a variable called dataset. Dataset variable now contains all the 6 columns of input and 1 output column.
plt.ylabel('Prognosis')
plt.xlabel('Temperature')
plt.scatter(dataset.temperature, dataset.prognosis)
plt.show()
plt.ylabel('Prognosis')
plt.xlabel('Num People at Home')
plt.scatter(dataset.num_people_at_home, dataset.prognosis)
plt.show()
For this demonstration, we will be showing two graphs. One graph is to show the relationship between the prognosis and temperature while the other one will show the relationship between the prognosis and the number of people at home shared with the patient.
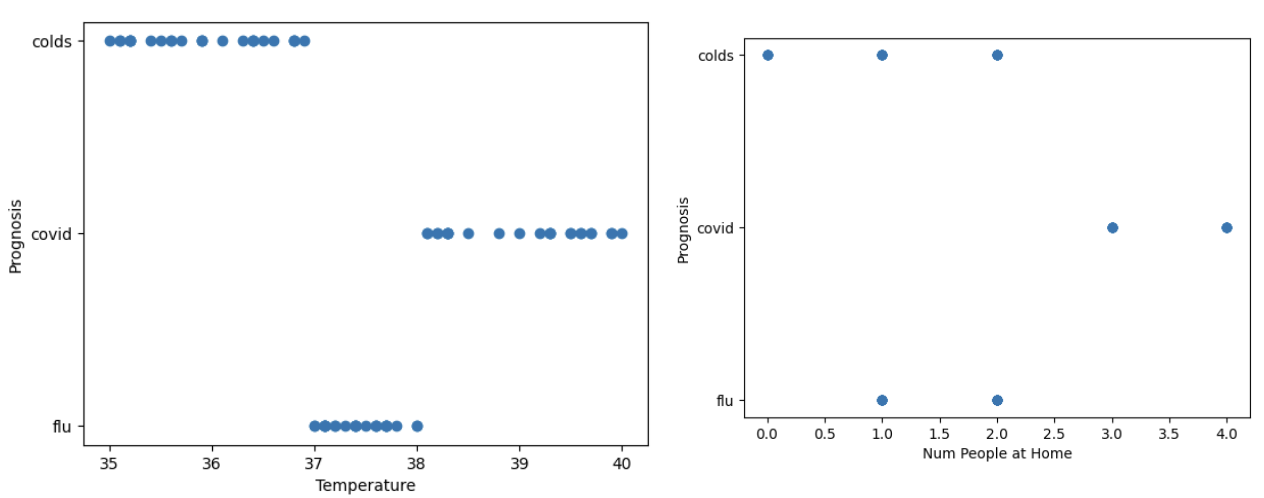
From the two graphs, we can clearly see a cluster between the three output classes for flu, colds, and covid. We can graph the other inputs versus the prognosis output column but this is enough for now.
# Convert strings to numeric
dataset.body_aches = dataset.body_aches.replace(to_replace=['no', 'yes'], value=[0, 1])
dataset.runny_nose = dataset.runny_nose.replace(to_replace=['no', 'yes'], value=[0, 1])
dataset.working_at_home = dataset.working_at_home.replace(to_replace=['no', 'yes'], value=[0, 1])
dataset.covid_vaccinated = dataset.covid_vaccinated.replace(to_replace=['no', 'yes'], value=[0, 1])
dataset.prognosis = dataset.prognosis.replace(to_replace=['flu', 'covid', 'colds'], value=[0, 1, 2])
LogisticRegression does not allow string values (yes/no inputs) during training so we convert those responses to numeric form such as 0 if no and 1 if yes. All the input columns that have yes/no values have been converted to numeric values. Also, the prognosis output column has been converted to numeric as well. For the output, 0 is for flu, 1 for covid, and 2 for colds.
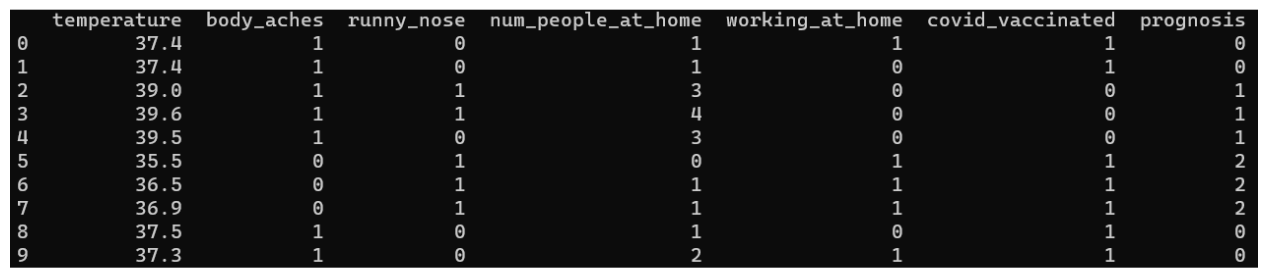
This is the content of the dataset variable after the conversion. All of the columns with string values including the output column have been converted to numeric. We will also be converting later on our test inputs and test outputs to numeric form.
# Create the Logistic Regression Model
model = LogisticRegression(max_iter=500)
model.fit(dataset[[
   'temperature',
   'body_aches',
   'runny_nose',
   'num_people_at_home',
   'working_at_home',
   'covid_vaccinated'
]], dataset.prognosis)
Create the model using the LogisticRegression library. The max_iter parameter in the constructor is to define the iterations the model will train. We specified this parameter with value 500 because we only have a few rows of data. The model.fit function in this sample code has two parameters. The first parameter is for the input which contains the six columns of data while the second parameter is the prognosis column.
# Test the model
test_temperature = 39
test_body_aches = 'yes'
test_runny_nose = 'yes'
test_num_people_at_home = 3
test_working_at_home = 'no'
test_covid_vaccinated = 'no'
Now that we are done creating and training the Logistic Regression Model, we will be testing it. We will be using the values of the third row of the CSV to test our model. For this row, the expected output should be covid since that is the prognosis value of that row.
# Convert the test values to numeric
test_body_aches = 1 if test_body_aches == 'yes' else 0
test_runny_nose = 1 if test_runny_nose == 'yes' else 0
test_working_at_home = 1 if test_working_at_home == 'yes' else 0
test_covid_vaccinated = 1 if test_covid_vaccinated == 'yes' else 0
The conversion codes in here are a little different in the conversion part for training the model. The important thing is that the values should still be the same such as 0 means no and 1 means yes.
output = model.predict_proba([[
   test_temperature,
   test_body_aches,
   test_runny_nose,
   test_num_people_at_home,
   test_working_at_home,
   test_covid_vaccinated
]])
Calculate the probability of each output class using the predict_proba function of the model. The output should contain three values because we have three classes of outputs. The first first numeric value should belong to the probability of flu since in our conversion of the output column, we assigned it at 0. The second numeric value should be the probability of covid while the third numeric value is the probability for colds. All of these three numeric output values should add to 1 since these outputs represent the probability of the test data we used.
print("FLU\t", "{:.4f}".format(output[0][0]))
print("COVID\t", "{:.4f}".format(output[0][1]))
print("COLDS\t", "{:.4f}".format(output[0][2]))
This is just formatting the output to make. The numeric output values are formatted and rounded off to 4 decimal places. Remember, our test data used to test the model is the third row of the CSV and it covid should have the highest probability value.
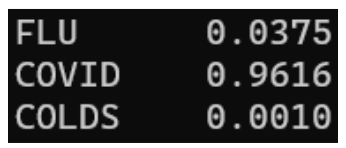
As expected, the class with the highest probability is the covid class since it has a probability of 0.96 or 96% chance that this test person has covid. The flu and colds probability values are low enough.
To view the full code and test CSV, go to the repository https://github.com/jamesnogra/SimpleLogisticRegressionPython. An installation instruction has been provided. This should run in any machine with python 3.6 or newer.